Nisha S

Master of Business IT @ La Trobe · AI & ML Graduate · Business Analysis & Digital Transformation

I work at the intersection of business and information systems. Each project below starts from a business question, works on real public data, and ends with what the numbers mean for the business and what to do next.

Labour-market analysis & dashboard

Skills-Demand Dashboard

Which occupations and regions are Australian employers advertising for, and is that demand rising or cooling?

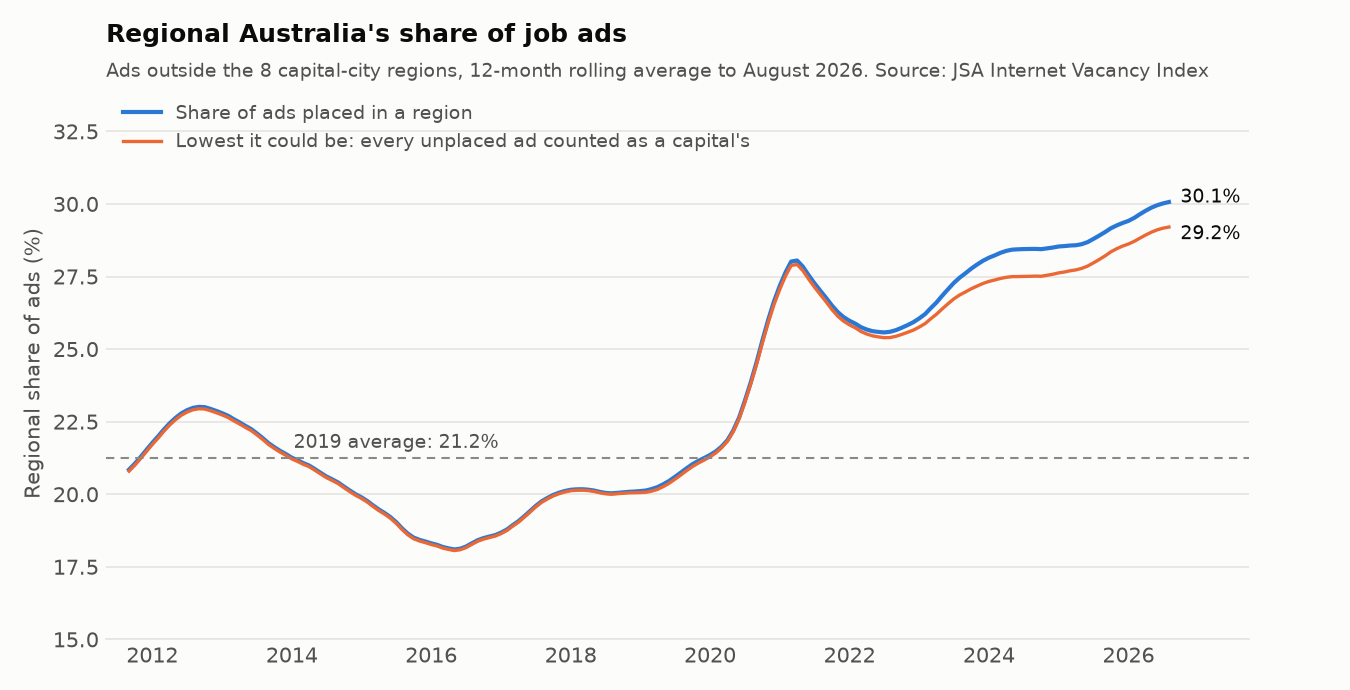
30.1% of placed job ads are now in regional Australia, up from 21.2% in 2019. Regional areas are +67.1% on 2019 against +4.9% for the capital-city regions

Job-ad demand analysis and a Streamlit dashboard on Jobs and Skills Australia's Internet Vacancy Index (August 2026 release), with every report rerun by GitHub Actions on each push. Read naively, the files mislead: a dashboard built straight from them would show an 18% "slump" from October to January every year and top its fastest-growing list with noise. With 12-month averages and a 20-ad floor, ads averaged 209,655 a month, −3.3% on the year before but +21.2% on 2019, and the latest 3 months are +0.9% on a year earlier. GPs and resident medical officers added 1,362 ads a month (+36.4%), and 47.3% of ads for medical practitioners and nurses are now regional. 22 big occupations are below 2019 and still falling, among them accountants and software programmers (−46.6% on 2019). The only regions below 2019 are Canberra & ACT, Sydney and Melbourne.

So what: A recruiter who only covers the capitals is working the shrinking part of the market: grow regional desks, starting with health and care. Training providers should put health, care and electrical courses first, with regional placements, and not size ICT, accounting or sales-management intakes on 2019 demand. Check a big jump in the monthly series before acting on it.

  • Python
  • pandas
  • Streamlit
  • Altair
  • matplotlib
  • pytest
  • GitHub Actions

Data: Internet Vacancy Index, Jobs and Skills Australia (CC BY 4.0) · Finished 2026-11-08 · Last commit 2026-11-08

Line chart of regional Australia's share of job ads, a 12-month rolling average from 2011 to August 2026, with the 2019 average of 21.2% marked. The share falls from about 23% in 2012 to about 18% in 2016, recovers to about 21% by 2020, jumps to about 28% in 2021, dips to 25.6% in 2022, then climbs to 30.1%. A second line, the lowest the share could be if every unplaced ad were a capital's, follows it closely and ends at 29.2%.

Procurement spend & compliance analytics

AusTender Procurement Spend

Where does Australian Government contract spend go, how dependent is it on a few suppliers, and do the competition and reporting rules hold up?

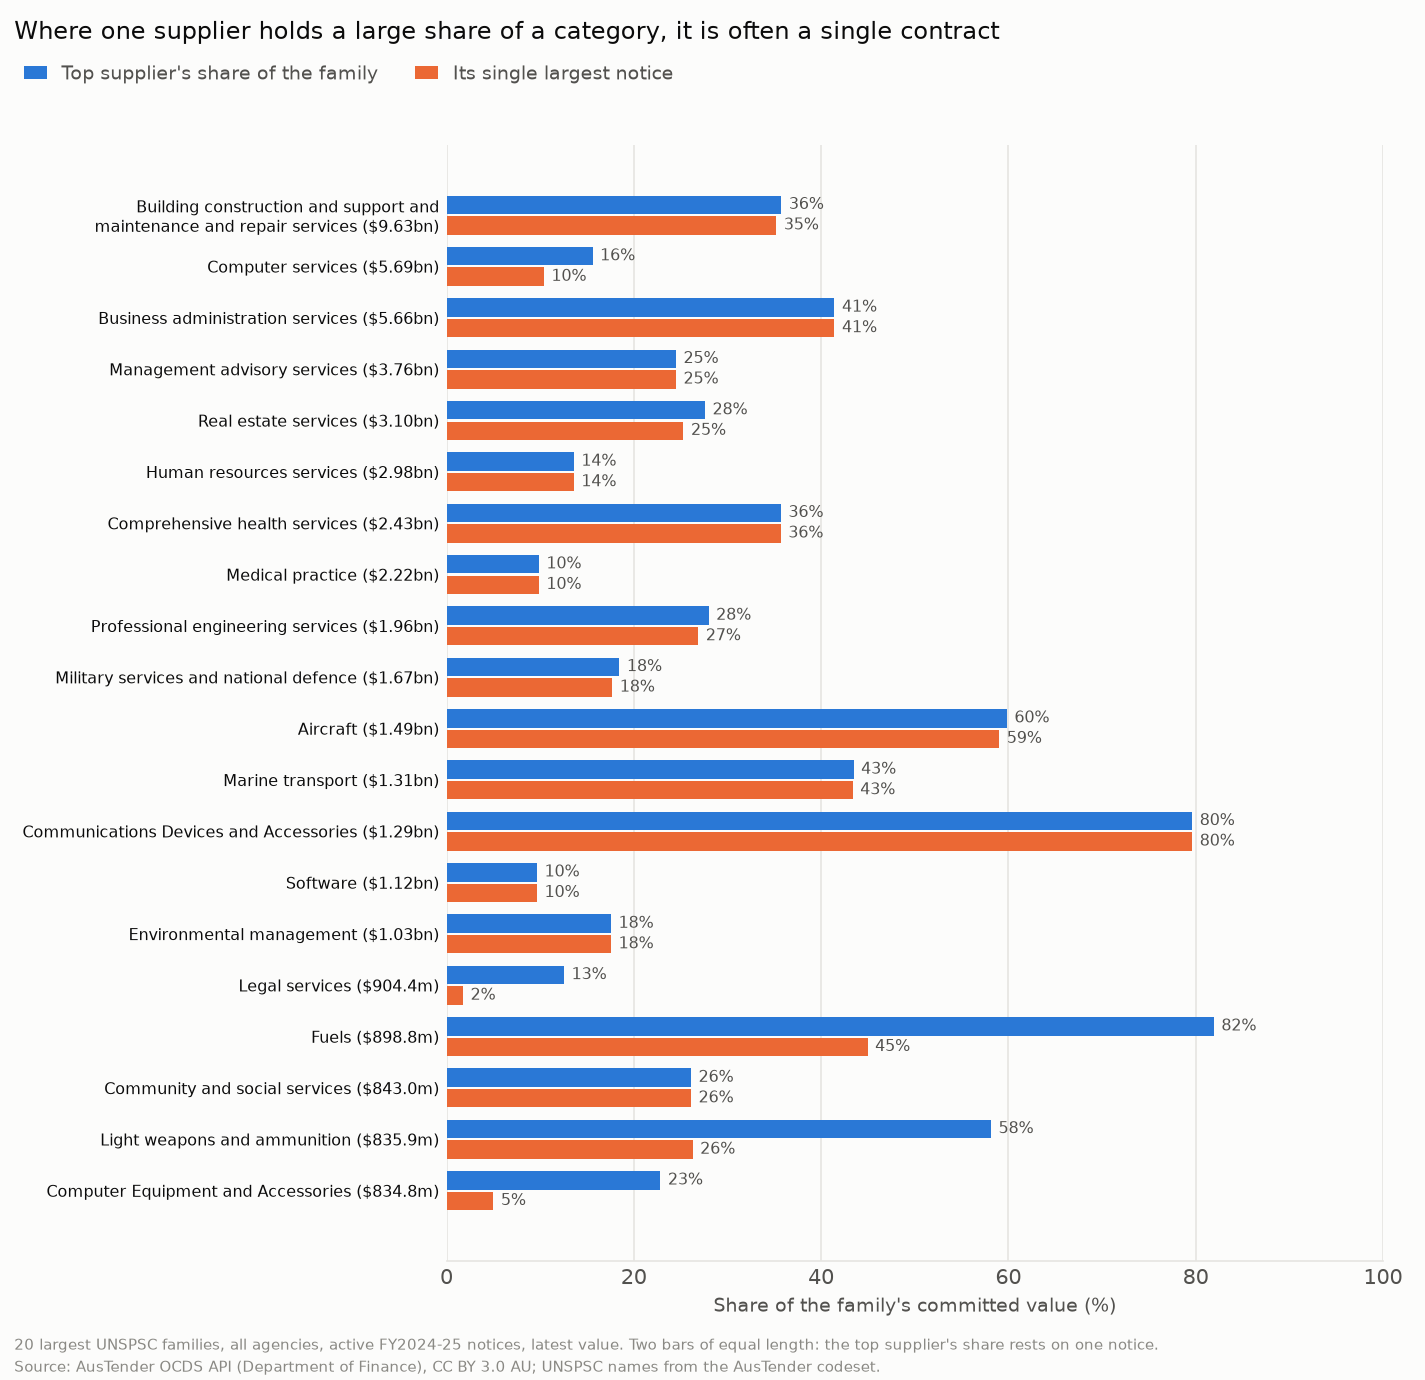
$4.17bn of large-category spend (7.5%) is concentrated beyond one contract. Far more, $19.11bn of common services, is bought by 20 or more agencies from long supplier tails

Spend, competition and compliance analytics in DuckDB SQL and Python on 59,464 contract notices first published in FY2024-25, from the official AusTender API, with every report rerun by GitHub Actions on each push. A dashboard built straight from the feed would mislead: summing every row overstates value 2.6 times, and three in four limited tenders are under the $80k line, where an open approach isn't required. Once that is fixed, 58 of 16,242 suppliers hold half of the $62.21bn committed. Only 54 of the 8,687 limited tenders from $80k cite no allowed reason, values bunch just under $80k (2.31 times the neighbouring bins) but not to avoid competition, and 51.6% of late notices come out in catch-up batches. Of $990.2m coded to Education and Training, 54.6% is programs delivered to the public, and 40.4% of notices say too little for anyone to place.

So what: Supplier dependence isn't the main risk; fragmentation is. Check how much of the common spend already goes through panels and pool the rest, test whether the stated reason fits for the $5.80bn of extensions and sole sources, report on current value rather than value at award, and sign 1 July renewals before they start.

  • SQL
  • DuckDB
  • Python
  • pandas
  • REST API
  • LLM categoriser
  • GitHub Actions

Data: AusTender OCDS API, Department of Finance (CC BY 3.0 AU) · Finished 2026-11-06 · Last commit 2026-11-06

Paired horizontal bar chart for the 20 largest UNSPSC families: the top supplier's share of each family's committed value, and the share held by that supplier's single largest notice. In most families the two bars are almost the same length, so the top supplier's share rests on one contract: communications devices 80% and 80%, aircraft 60% and 59%, business administration 41% and 41%. Fuels (82% against 45%) and light weapons and ammunition (58% against 26%) are concentrated beyond one contract. Computer services, $5.69bn, has a top supplier share of 16%.

Process mining & audit analytics

Purchase-to-Pay Process Mining

In a real purchase-to-pay process, are invoices cleared only after the right checks, where do items actually wait, and what work is redone or worth automating?

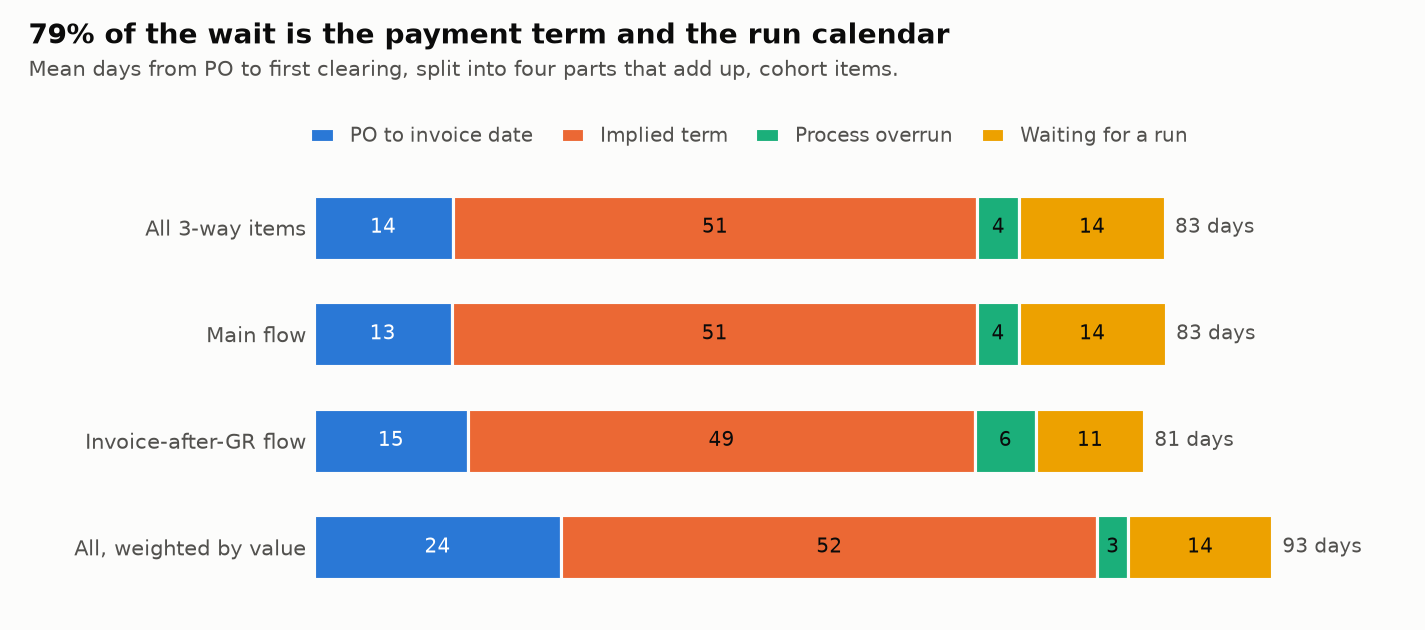
5.0% of the mean 83.0 days from purchase order to first clearing is process overrun. 61.6% is the vendor's implied payment term and 17.1% is waiting for a payment run

Process mining in DuckDB SQL and Python on the BPI Challenge 2019 log: 1.6 million events on 251,734 purchase items at a coatings multinational based in the Netherlands, with every report rerun by GitHub Actions on each push. Seven plausible readings of the log turn out to be wrong: summing its value field, for one, overstates it 28.6 times. 10 of 21 compliance rules had no failures, and a plain count of invoices "cleared with no goods" is about 8 times too high until reversed invoices are taken out. Payment blocks are behind 61.7% of overrun days, and 48.4% of blocks have no reason visible in the log. A PO price changed after the invoice affects 1,860 items holding 14.6% of value: 92.2% of those that can be timed were blocked, and they cleared 4.0 days later than comparable items.

So what: Don't send a team to fix invoice-to-clearing time: most of it is agreed terms and the payment-run calendar, which is a treasury decision. Fix PO prices before the invoice arrives, record a reason for every payment block, bring in e-invoicing, and ask finance whether the groups that rarely clear are settled outside this system.

  • SQL
  • DuckDB
  • Python
  • pandas
  • Process mining
  • GitHub Actions

Data: BPI Challenge 2019, 4TU.ResearchData (CC BY 4.0) · Finished 2026-11-03 · Last commit 2026-11-03

Stacked bar chart of the mean days from purchase order to first clearing, split into four parts that add up. For all 3-way items, 83 days: 14 from PO to invoice date, 51 of implied payment term, 4 of process overrun and 14 waiting for a payment run. The main flow is the same, the invoice-after-GR flow is 81 days, and weighted by value it is 93 days, of which 52 are the implied term and 3 are overrun.

Forecasting for operations planning

NEM Demand Forecasting

How well can methods a planner can explain predict tomorrow's electricity demand, and how much buffer should they hold for the error that's left?

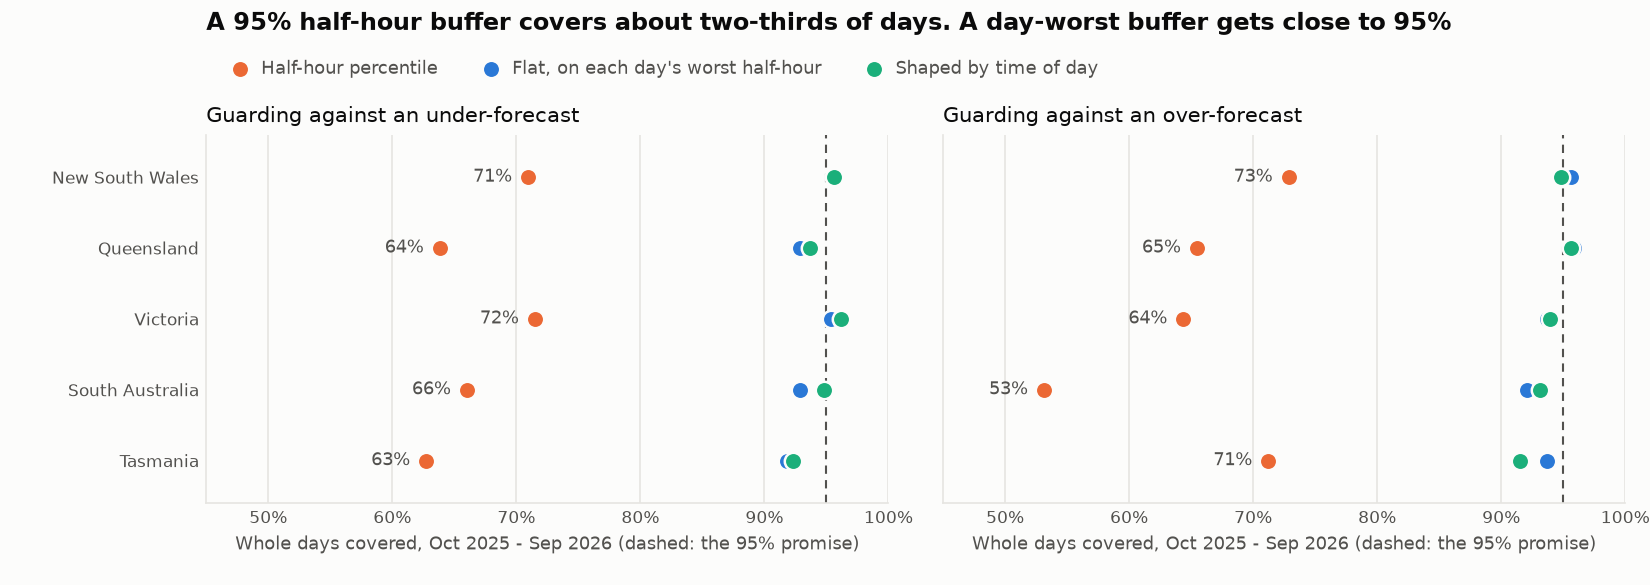
66% of days were fully covered by a "95%" buffer built the usual way, on half-hours. Sizing on each day's worst half-hour and shaping it by time of day covered 94.2%

A rolling backtest of half-hourly demand across Australia's 5 NEM regions, on AEMO data from Jan 2019 to Sep 2026, rerun by GitHub Actions on every push. Tuned on one year and scored on a held-out year (Oct 2025 – Sep 2026), a blend of smoothed recent demand and a corrected 3-year average, plus a small adjustment for forecast heat, cold and sun, reaches 3.3-8.5% day-ahead error. That's 22-45% below each region's best simple baseline and 36-55% below the usual "same day last week". The shaped buffer uses 3-21% less cover than a flat one, though it covered 88.6% of summer days against 97.6% of winter ones. Weather takes 8-69% off the spot cost of forecast error, yet a fixed timetable timed a battery as well or better in 4 of 5 regions.

So what: Replace "same day last week" with the blend and a weather forecast, sun included. Size buffers on each day's worst half-hour, add cover in summer, match the hedge to the region, and keep a battery on a timetable until a price forecast beats it.

  • Python
  • pandas
  • NumPy
  • DuckDB
  • SQL
  • GitHub Actions

Data: AEMO Aggregated price and demand data (any use, with attribution); ECMWF forecasts via Open-Meteo (CC BY 4.0) · Finished 2026-11-01 · Last commit 2026-11-01

Dot chart of the share of whole days covered from Oct 2025 to Sep 2026 by day-ahead buffers with a 95% promise, for 5 regions, guarding against under-forecasts and over-forecasts. A half-hour percentile covered 53% to 73% of days. Buffers sized on each day's worst half-hour, flat or shaped by time of day, sit between about 91% and 96%, close to the 95% line.

Data warehouse & BI model (dbt + DuckDB)

Airline On-Time Warehouse

Which Australian airlines and routes actually run on time, has punctuality recovered since COVID, and what should a corporate travel team book?

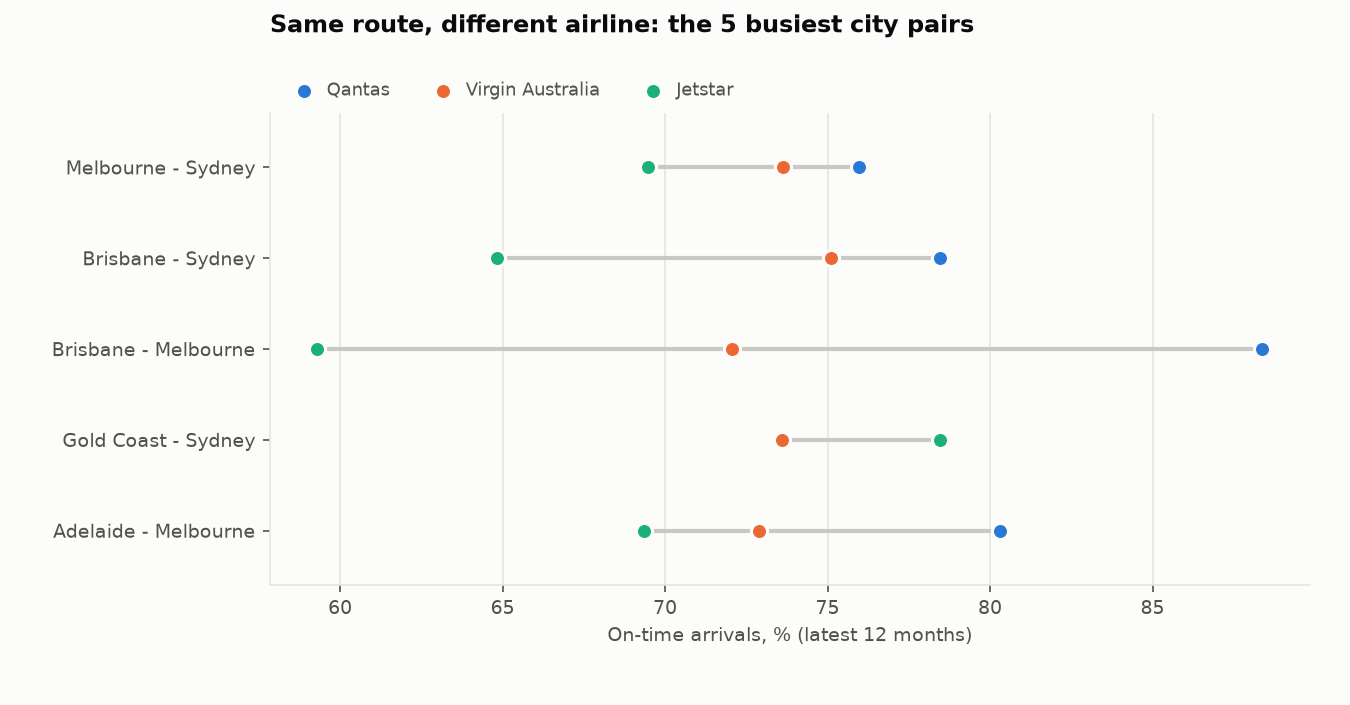
29.1 pts gap in on-time arrivals between Qantas (88.4%) and Jetstar (59.3%) on the same route, Brisbane–Melbourne, in the 12 months to Sep 2026

A tested star-schema warehouse built with dbt-core on DuckDB from BITRE's monthly on-time data since 2004. The raw file stacks four grains in one table, so a naive sum overstates national flights 3.51×; the warehouse splits it into two facts at their own grain, guarded by 166 dbt tests and 55 pytest tests and rerun by GitHub Actions on every push. 77.9% of flights arrived on time in the latest 12 months, against 79.4% in FY2018-19. On the 5 busiest city pairs, airlines on the same route are 4.9 to 29.1 points apart, while the routes themselves are within 3.2 points. A Power BI model with 31 DAX measures and check queries carries the same rules.

So what: Pick the preferred airline route by route rather than network-wide, budget for lateness on the worst routes, keep cancellation-prone routes like Canberra–Sydney off the last flight of the day, and report from the warehouse, never the raw file.

  • SQL
  • dbt-core
  • DuckDB
  • Python
  • Power BI / DAX
  • GitHub Actions

Data: BITRE Domestic Airlines – On Time Performance, data.gov.au (CC BY 3.0 AU) · Finished 2026-10-29 · Last commit 2026-10-29

Dot chart of on-time arrivals by airline over the 12 months to Sep 2026 on the five busiest city pairs. On Brisbane–Melbourne, Qantas ran 88.4% on time, Virgin Australia 72.1% and Jetstar 59.3%. On Melbourne–Sydney the spread is narrower: Qantas 76.0%, Virgin Australia 73.6%, Jetstar 69.5%. On Gold Coast–Sydney, Jetstar (78.5%) beat Virgin Australia (73.6%).

Housing market & affordability analysis

Victorian Rental Market Analysis

Where are rents in Victoria rising fastest, who can still afford to rent, and how has that changed since before COVID?

36.4% of new leases in regional Victoria were affordable to a lower-income household in Sep 2025, down from 46.8% in Sep 2019

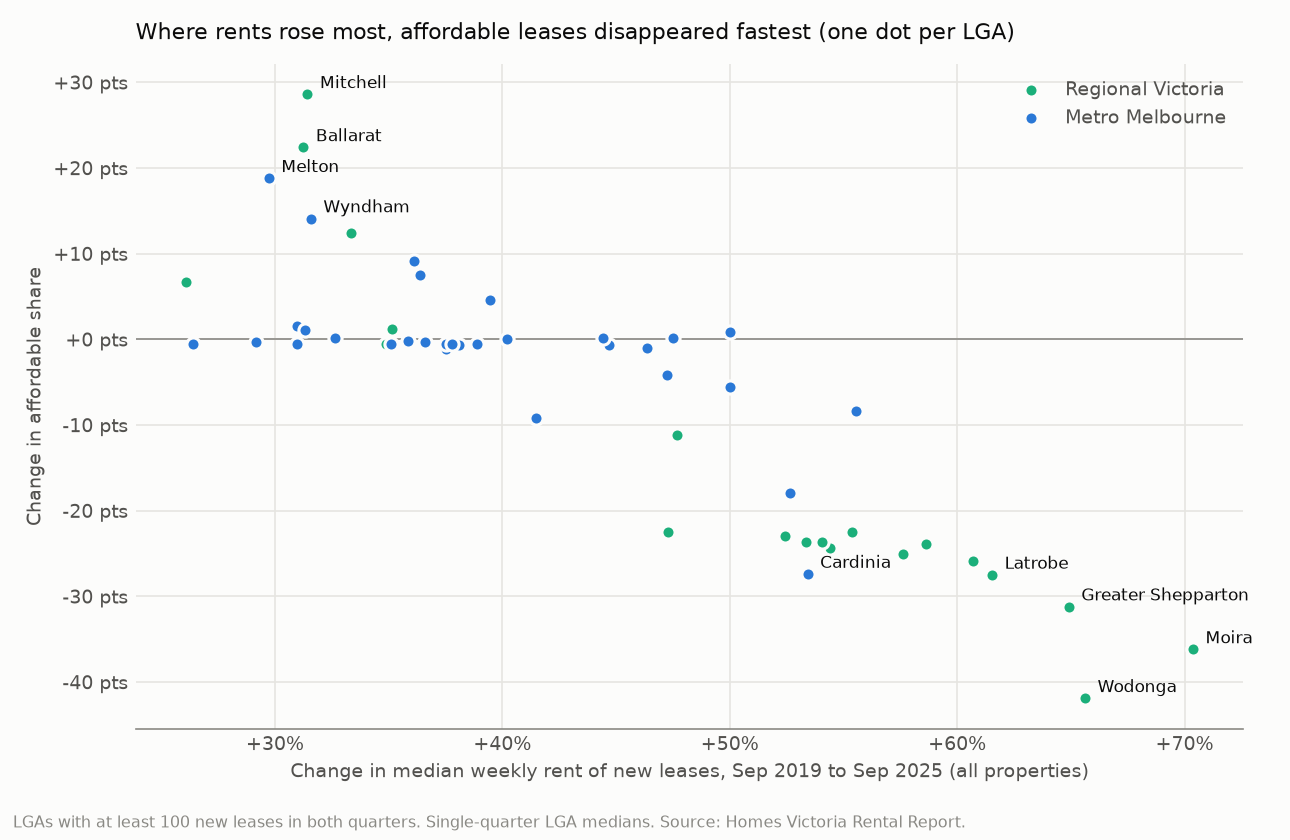
DuckDB SQL over 25 years of Homes Victoria rental-bond data, joined to ABS inflation, building approvals and Census dwellings, after an audit that reconciles the parsed tables with the published report. The median new lease rose from $400 to $550 a week since Sep 2019 (+11.5% after inflation), but fell 0.7% in real terms in the last year. Regional Victoria rose 46.9% against Melbourne's 36.9%, and affordability clearly fell in 13 of 20 well-sampled regional LGAs against 4 of 31 in Melbourne. Where more homes were built, rents rose less (median 36.5% against 47.5%).

So what: Aim rent support and social housing at regional cities and single-parent households first, keep the growth corridors building, and budget 2026 rent reviews on flat real rents.

  • SQL
  • DuckDB
  • Python
  • pandas
  • ABS Data API

Data: Homes Victoria Rental Report – Quarterly; ABS CPI, Building Approvals and Census 2021 (all CC BY 4.0) · Finished 2026-10-26 · Last commit 2026-10-26

Scatter chart with one dot per Victorian LGA: change in the median weekly rent of new leases from Sep 2019 to Sep 2025 against the change in the share of new leases affordable to a lower-income household. Where rents rose about 30%, as in Mitchell, Ballarat, Melton and Wyndham, the affordable share rose by 14 to 29 points. Where rents rose 61 to 70%, in the regional LGAs of Latrobe, Greater Shepparton, Wodonga and Moira, it fell by 27 to 42 points.

Applied AI & governed self-service analytics

LLM SQL Report Helper

Can managers safely ask a database business questions in plain English, and how would we know whether the answers are right?

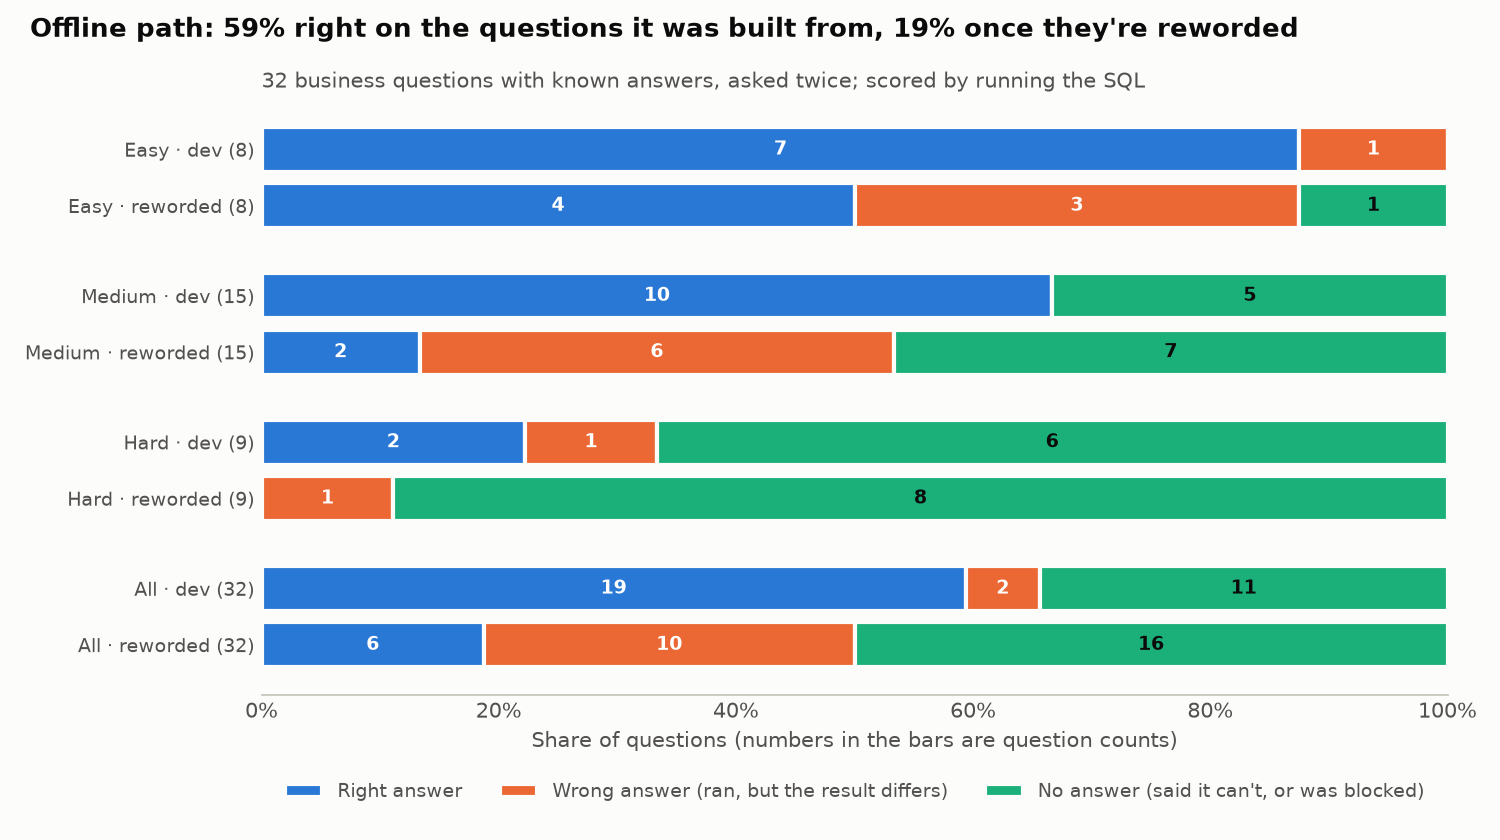
38% of the offline path's numbers were right on reworded questions, against 90% on the wording it was built from

Plain-English questions become guarded SQL and a short report. Personal data and writes are blocked inside SQLite, so the guard rejects all 5 naive privacy and write queries however the model behaves. Any backend is scored on 32 questions with gold answers plus the same questions reworded: the offline semantic layer gets 59% right on its own wording and 19% reworded. A number check on the summaries refused 788 of 788 planted changes to money and percentage figures. The Claude backend is built and tested, and its score is pending an API key.

So what: Enforce data access in the database rather than the prompt, gate every model or prompt change on a held-out score, and always show the result table under a generated summary.

  • SQL
  • SQLite
  • Python
  • Claude API
  • LLM evaluation

Data: Chinook sample database (MIT-style licence) · Finished 2026-10-24 · Last commit 2026-10-24

Stacked bar chart of the offline path's answers to 32 business questions, asked in the wording it was built from and reworded. Overall: 19 right, 2 wrong and 11 with no answer on its own wording; 6 right, 10 wrong and 16 with no answer reworded. By level, easy goes from 7 of 8 to 4 of 8 right, medium from 10 of 15 to 2 of 15, and hard from 2 of 9 to 0 of 9.

Data-quality testing & pipelines

Data-Quality Pipeline on DuckDB

Which foot-traffic reports built on Melbourne's live pedestrian-sensor feed can the business trust today, and which need a caveat or shouldn't be used?

3 of 7 common foot-traffic reports shouldn't be used as usually built (snapshot 2026-10-18)

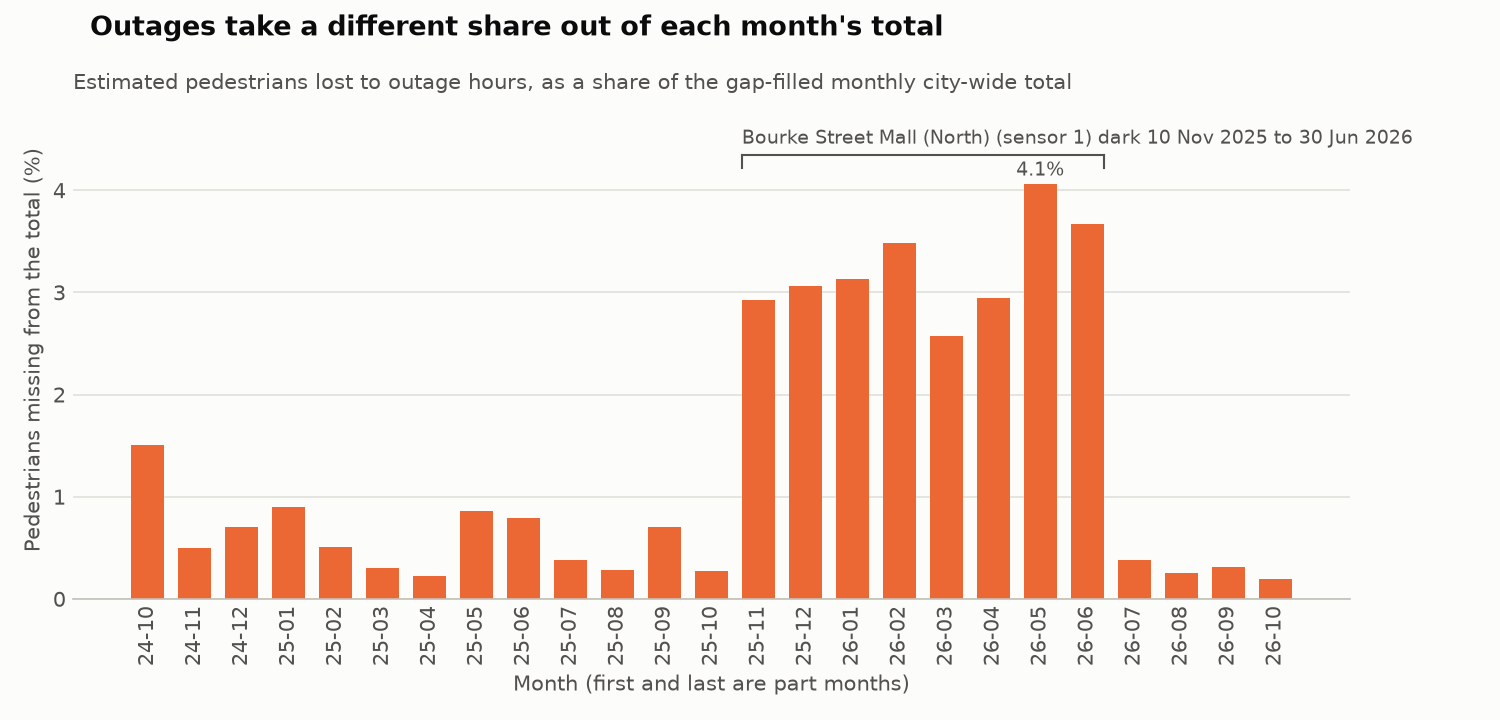
dbt-style checks written from scratch (YAML compiled to SQL on DuckDB) find that 8.30% of rows share their id with another sensor and 5.67% of sensor-hours are missing, 43.0% of them likely zeros the feed doesn't publish. Year-on-year growth is +3.8% on the published totals but +6.2% like-for-like. A daily GitHub Actions gate reruns everything and goes red only on errors nobody has reviewed.

So what: Show the last complete day instead of 'yesterday', compare periods like-for-like with a coverage column, and join on sensor and date, never the published id.

  • SQL
  • DuckDB
  • Python
  • YAML data tests
  • GitHub Actions

Data: City of Melbourne Pedestrian Counting System (CC BY 4.0) · Finished 2026-10-21 · Last commit 2026-10-21

Bar chart of the estimated share of pedestrians missing from each month's city-wide total because of sensor outages, October 2024 to October 2026. Most months are 0.20–1.51% short; November 2025 to June 2026 are 2.58–4.06% short, while Bourke Street Mall (North) was dark.

Marketing & sales funnel analysis

Marketing Lead Funnel Analysis

Which marketing channels bring a marketplace sellers who sign and then actually sell, and why did conversion fall in May 2018?

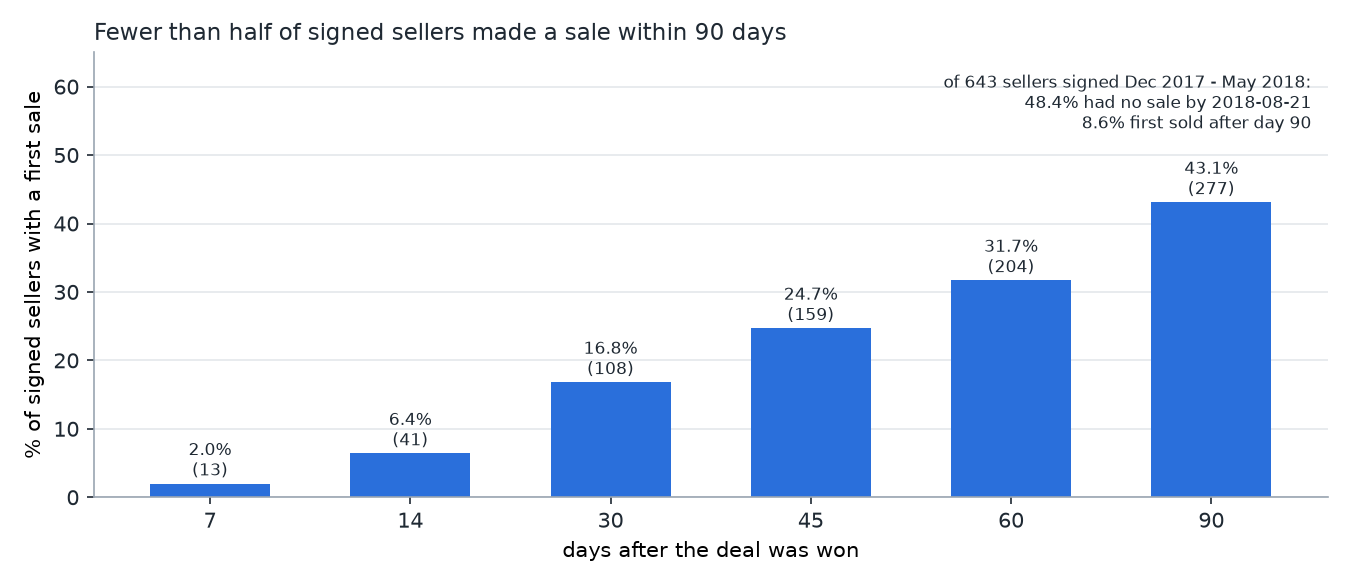
43.1% of signed sellers made a sale within 90 days of signing

DuckDB SQL over 8,000 Olist leads, joined to ~99k marketplace orders: 11.3% of Jan–May 2018 leads signed within 90 days, so roughly 49 in 1,000 leads became a selling seller. Paid and organic search sign leads at the same rate, but paid-search sellers start selling more often (55.0% vs 39.1%). May's fall (12.1% → 8.4%) came from weaker conversion within channels, not a worse lead mix.

So what: Measure the funnel to the first sale, not the signature: check every seller with no sale by day 30, and give manufacturers and offline businesses, who sign but rarely sell, an onboarding path.

  • SQL
  • DuckDB
  • Python
  • Wilson intervals
  • shift-share analysis

Data: Olist Marketing Funnel + Brazilian E-commerce (CC BY-NC-SA 4.0) · Finished 2026-10-18 · Last commit 2026-10-18

Bar chart of the share of 643 signed sellers with a first sale, by days after the deal: 2.0% by day 7, 6.4% by day 14, 16.8% by day 30, 24.7% by day 45, 31.7% by day 60 and 43.1% by day 90. 48.4% had no sale by 2018-08-21.

Algorithms for operations data

Data Structures in Practice

How many NYC 311 service requests report an issue that's already open, and where do they come from?

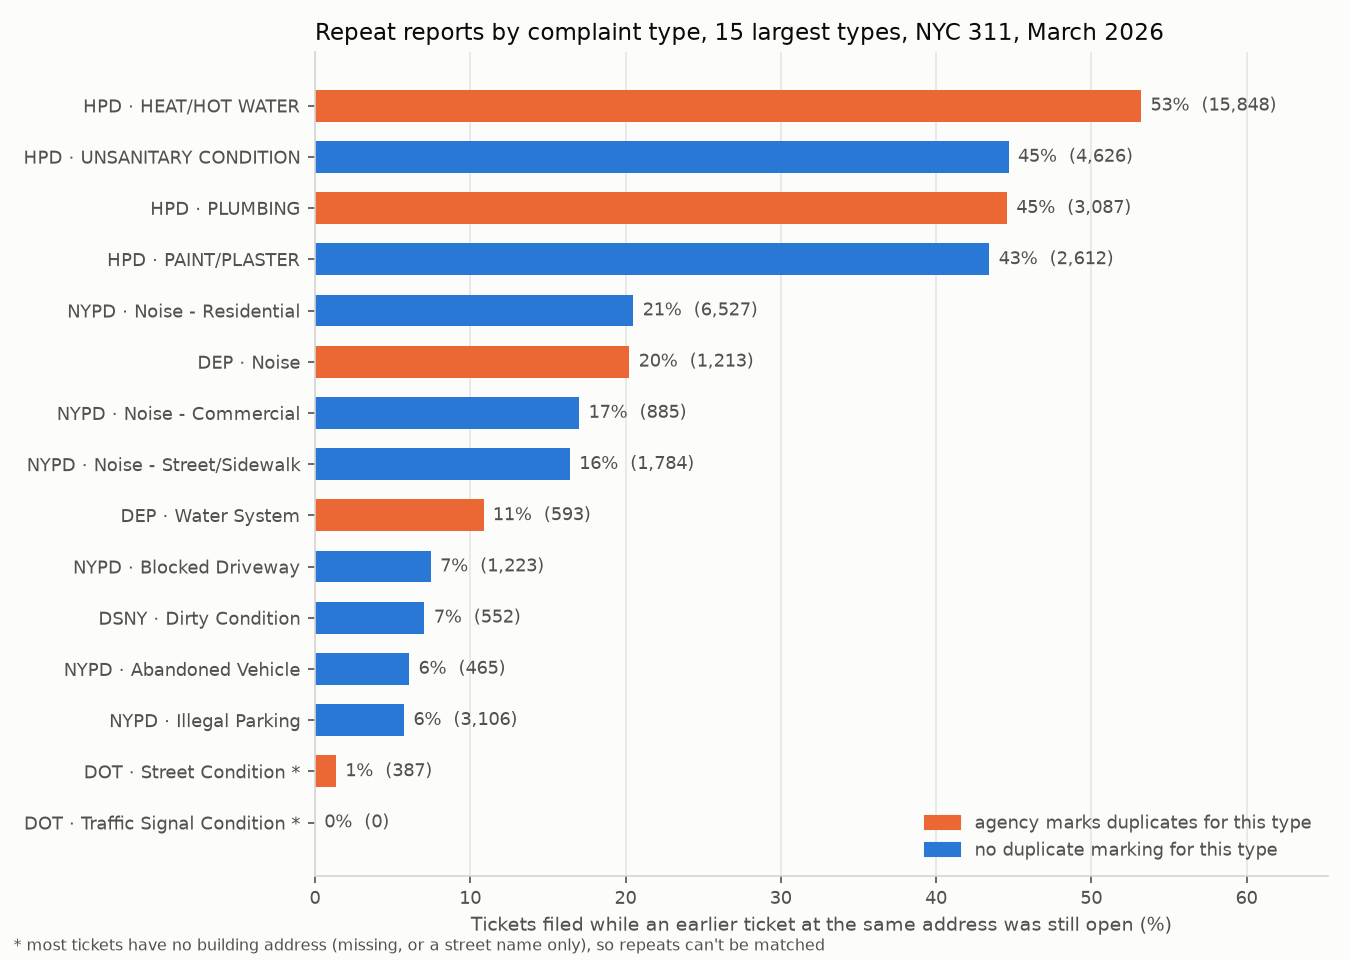
16.9% of 342,390 tickets in March 2026 repeated an issue that was still open at the same building

A hash-map check finds 97.5% of the housing agency's (HPD) own heat duplicate flags and covers the month in 0.23 s, against about 1.4 hours for the naive scan. Matching nearby tickets within 100 m finds 66.8% of the water agency's (DEP) duplicate flags, against 23.3% by exact address.

So what: A repeat check at intake, plus distinct-issue counts next to ticket counts, keeps queues and dashboards from counting the same problem many times.

  • Python
  • hash maps
  • heaps
  • sweep line
  • union-find
  • numpy / scipy

Data: NYC Open Data: 311 Service Requests · Finished 2026-10-14 · Last commit 2026-10-14

Bar chart of the share of repeat reports for the 15 largest NYC 311 complaint types. HPD heat and hot water is highest at 53%, followed by HPD unsanitary condition and plumbing at 45%.

Cloud data engineering

Serverless Property Data Lake

Can a monthly government property file land in a cheap, safe, queryable AWS-style data lake, and what does it say about the housing market?

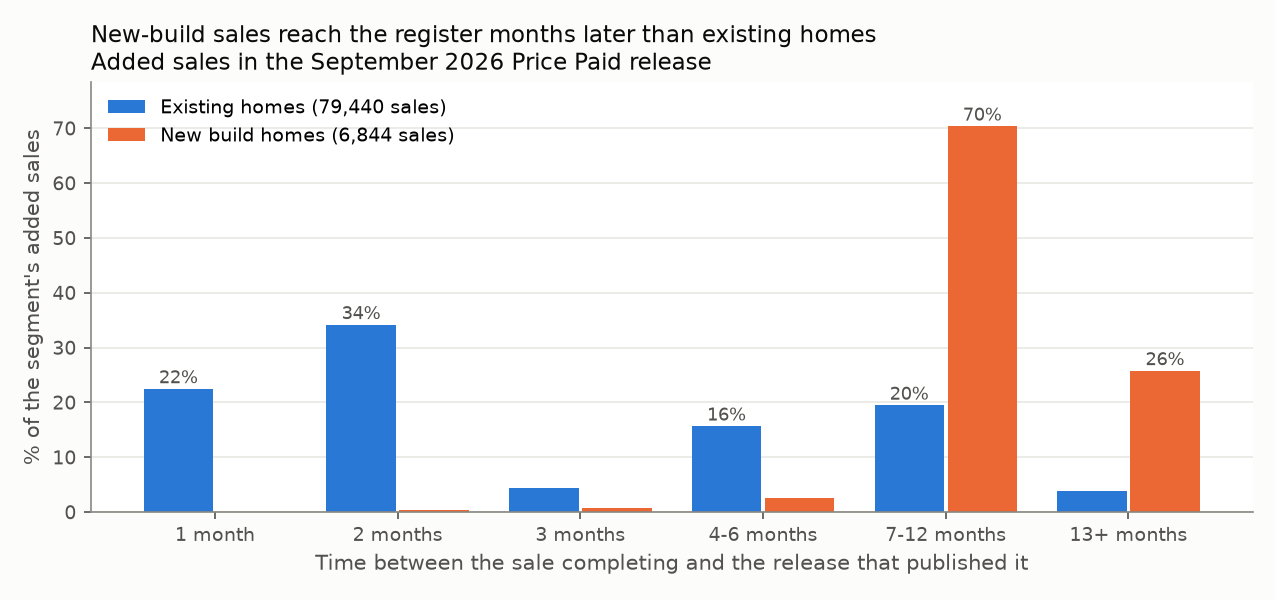
96.2% of new-build sales in the September 2026 release had completed 7+ months earlier

An S3 + Lambda pattern turns the 90,867-row monthly file into validated, address-free Parquet that SQL queries in place, for about $0.05 a month at London list prices. It runs offline on an S3 emulator, and the function's IAM policy is tested with enforcement on.

So what: The latest months are incomplete when published, so a 'latest month' chart shows a slowdown that isn't real: mark the last three months as provisional.

  • Python
  • AWS S3 + Lambda (moto)
  • Parquet
  • DuckDB
  • AWS SAM
  • IAM

Data: HM Land Registry Price Paid Data (OGL v3.0) · Finished 2026-10-10 · Last commit 2026-10-22

Grouped bar chart of the time between a sale completing and the release that published it. Most existing-home sales arrive within 2 months, while 70% of new-build sales arrive 7 to 12 months later and 26% after 13 or more months.

Applied AI / text analytics

LLM Review Categoriser

Which themes (battery, call quality, durability, service…) drive negative product reviews, so a product team knows what to fix first?

1 in 11 negative reviews (46 of 497) say the product doesn't work, broke or died

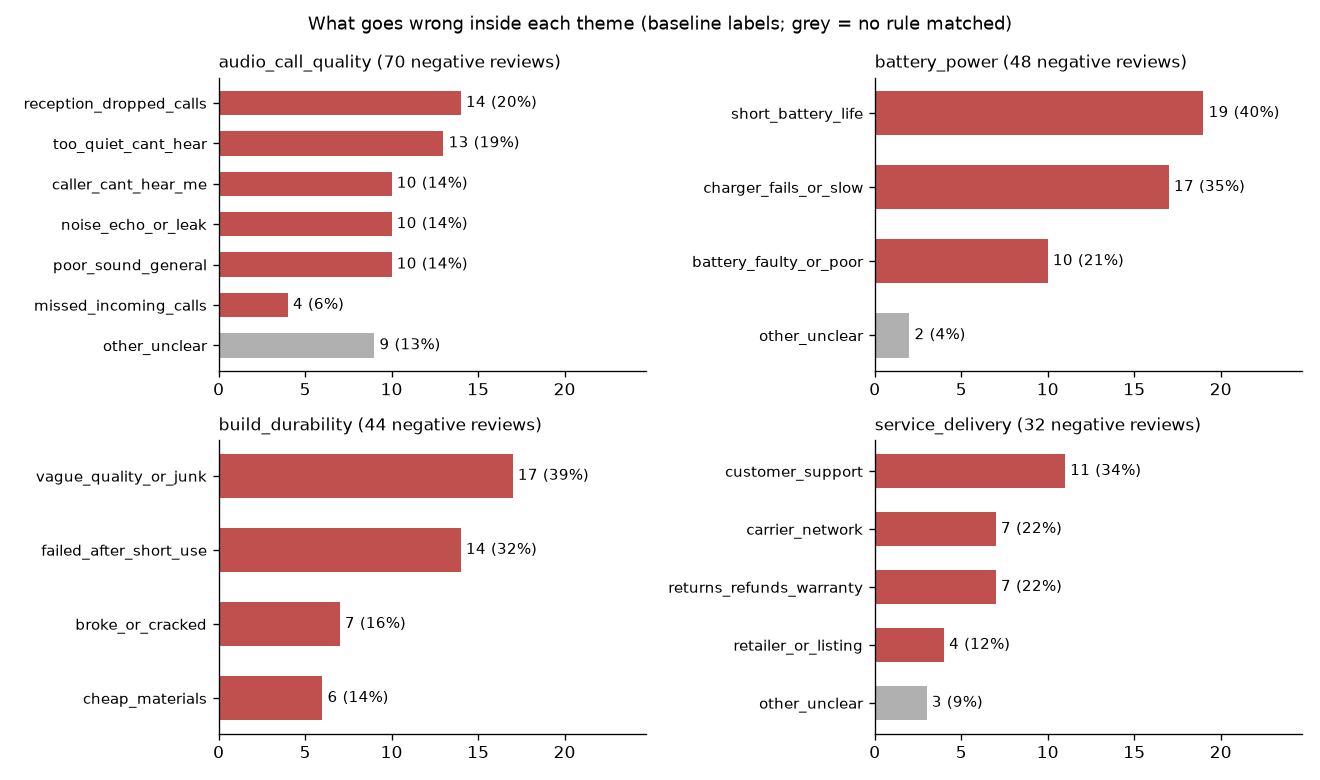
990 reviews are sorted into 9 business themes (a Claude backend plus an offline keyword baseline, 63.3% accurate on a hand-labelled sample), then split into concrete sub-issues. Only 13 of the 46 'doesn't work' reviews land in the durability theme, and charger faults are almost as common as short battery life (17 vs 19).

So what: A theme dashboard alone hides product failure. Track it as its own KPI across themes, and fix charger compatibility in listings.

  • Python
  • LLM API (Claude)
  • pandas
  • evaluation vs gold sample

Data: UCI Sentiment Labelled Sentences (CC BY 4.0) · Finished 2026-10-08 · Last commit 2026-10-08

Four bar charts of sub-issues inside the most negative review themes: audio and call quality, battery and power, build durability, and service and delivery. Short battery life (19) and charger faults (17) lead the battery theme.

Interactive dashboard

Retail KPI Dashboard

Is the business growing, and what is driving the change in revenue year on year?

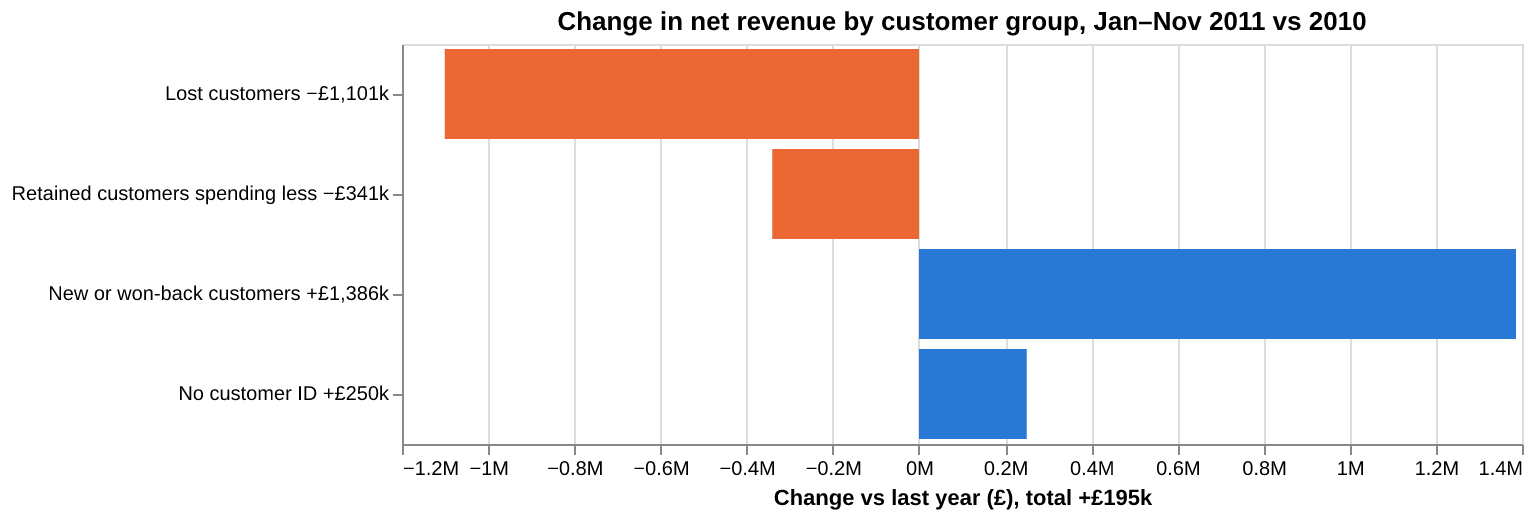
£1.10M of last year's customer spend (37% of customers) did not come back

A Streamlit dashboard on 1M retail transactions: KPI tiles with year-on-year deltas, country and product drivers, and a customer revenue bridge. Net revenue rose only +2.3% (Jan–Nov 2011 vs 2010) while new customers filled the gap left by lapsed ones; the UK grew +0.2% and non-UK +15.1%.

So what: Flat headline growth hides heavy churn. The first lever is winning back lapsed accounts, then watching the one EIRE account that alone fell by £59.8k.

  • Python
  • Streamlit
  • pandas
  • Altair
  • unit-tested KPIs

Data: UCI Online Retail II (CC BY 4.0) · Finished 2026-10-06 · Last commit 2026-10-06

Horizontal bar chart of the change in net revenue by customer group, Jan–Nov 2011 vs 2010: lost customers minus £1,101k, retained customers spending less minus £341k, new or won-back customers plus £1,386k, no customer ID plus £250k; total plus £195k.

SQL case study

E-commerce Funnel & Delivery Analysis

Where do marketplace orders leak, and what does late delivery cost in customer satisfaction?

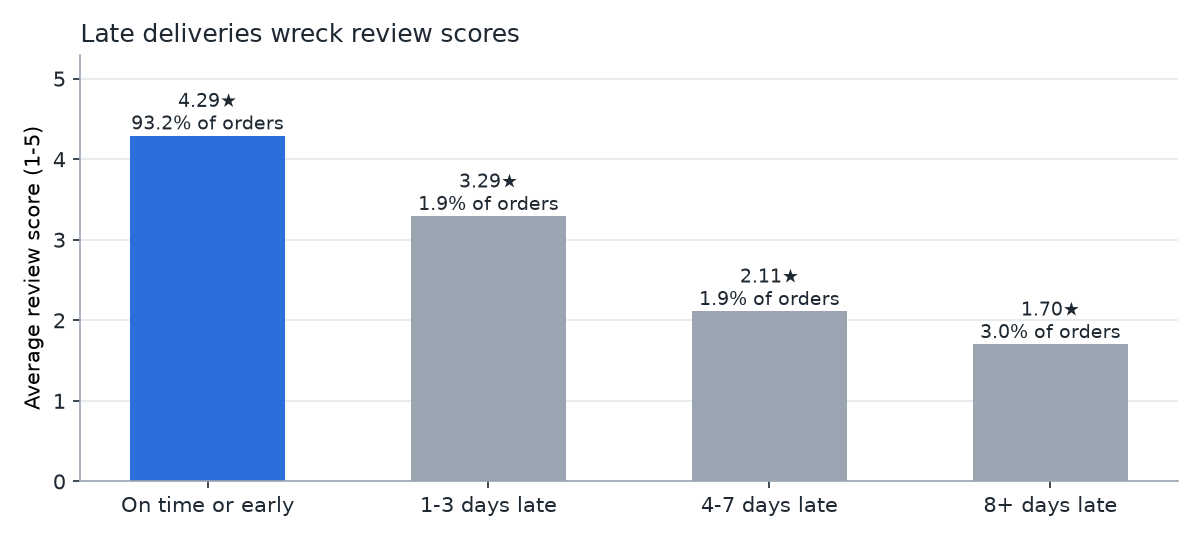
79.1% of orders delivered 8+ days late get a 1–2★ review, vs 9.2% of on-time orders

DuckDB SQL over ~99k orders: 97.1% are delivered, and the 2,888 that aren't carried ~R$414k of item value. 72.3% of late orders left the seller on time, so the carrier leg causes most lateness, and Rio de Janeiro alone is 26.3% of carrier-side late orders.

So what: Set delivery promises by destination and fix the Rio de Janeiro carrier leg: most late orders had already left the seller on time.

  • SQL
  • DuckDB
  • Python
  • cohort analysis

Data: Olist Brazilian E-commerce (CC BY-NC-SA 4.0) · Finished 2026-10-04 · Last commit 2026-10-22

Bar chart of average review score by delivery lateness: 4.29 stars on time or early, 3.29 for 1–3 days late, 2.11 for 4–7 days late, and 1.70 for 8 or more days late.

API data pipeline

FX Rates Pipeline

How much does currency movement cost an Australian importer, and which budget-rate policy misses by less?

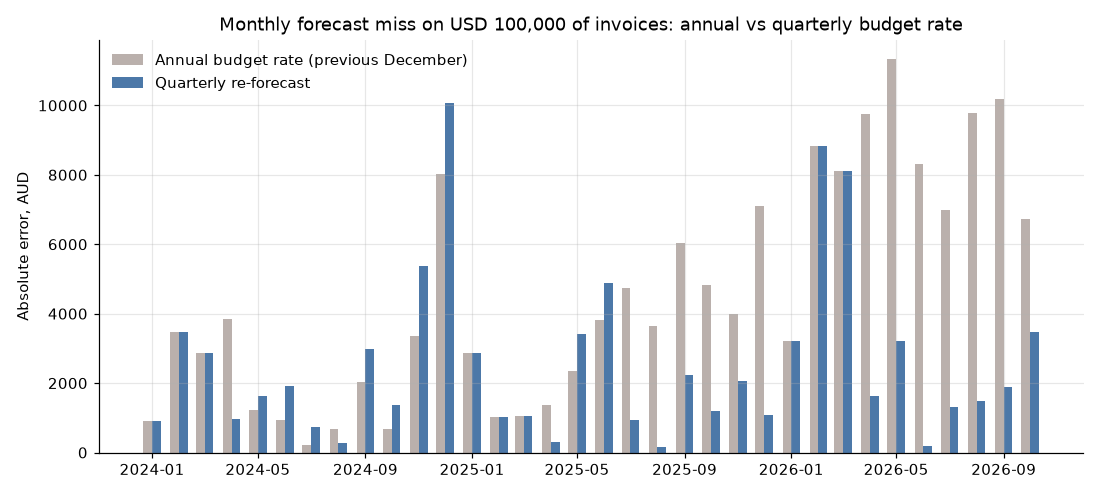
−43% average monthly budget miss when the USD rate is re-forecast quarterly instead of yearly

A self-updating ETL pulls ECB rates from a public API into a validated SQLite store every business day via GitHub Actions, and five SQL queries build an FX-exposure report. On USD 100k a month of invoices, the mean monthly miss falls from 4,474 to 2,534 AUD (as of 2026-09-30).

So what: Finance teams can cut forecast error by re-forecasting the budget rate each quarter, using a rate history that maintains itself.

  • Python
  • REST API
  • SQLite
  • SQL window functions
  • GitHub Actions

Data: European Central Bank rates via the Frankfurter API · Finished 2026-10-02 · Last commit 2026-11-06

Monthly bar chart from January 2024 of the absolute forecast miss on USD 100,000 of invoices, comparing an annual budget rate with a quarterly re-forecast. The quarterly bars are lower in most months of 2025 and 2026.

Data cleaning + exploratory analysis

Retail Data Cleaning & EDA

Can 540k messy retail transactions be cleaned into numbers finance and marketing can trust, and what do they show?

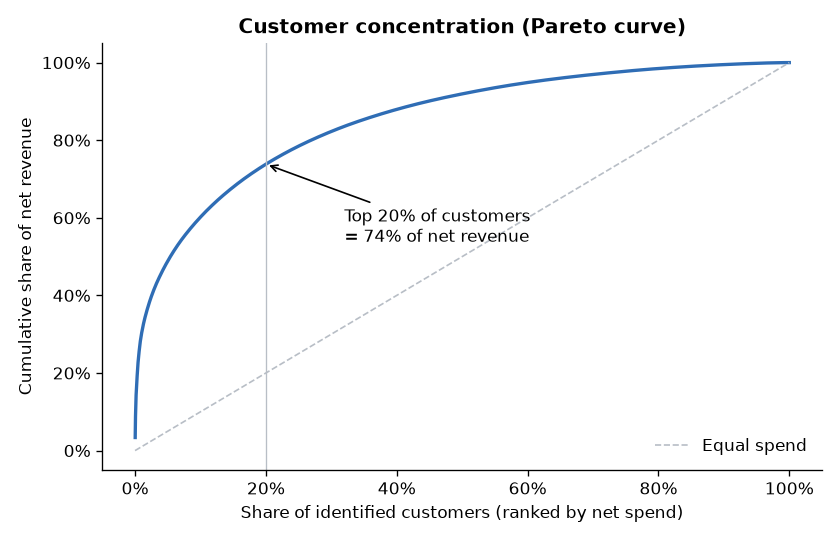
73.8% of net revenue comes from the top 20% of identified customers

A logged, rule-by-rule cleaning pipeline records the rows and £ impact of every decision. The analysis finds strong Sep–Nov seasonality, 41.3% of pre-June customers lapsed (£725,721 lifetime revenue), and guest checkout hiding 14.7% of revenue from customer-level analysis.

So what: Run a key-account programme for the top accounts, win back lapsed wholesalers before the autumn peak, and capture an email at checkout.

  • Python
  • pandas
  • data-quality audit
  • matplotlib

Data: UCI Online Retail (CC BY 4.0) · Finished 2026-09-28 · Last commit 2026-09-28

Pareto curve of cumulative net revenue against the share of identified customers ranked by spend. The top 20% of customers bring 74% of net revenue.

SQL analytics

SQL Business Analytics

Is a digital store growing, where does revenue come from, and which customers should it protect?

0 new customers acquired after 2010, so revenue has sat flat at about $450–480 a year

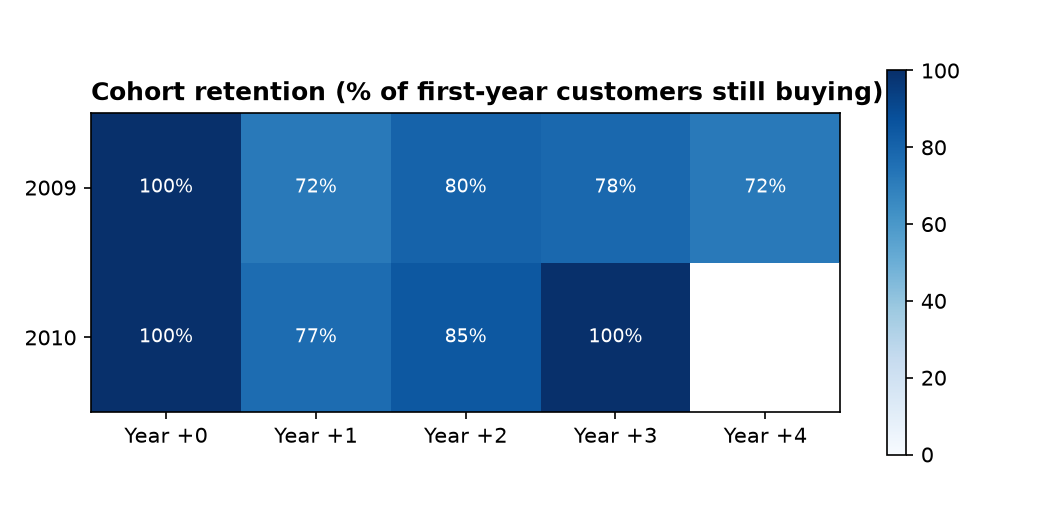
Eight business questions answered in documented SQL (KPIs, market concentration, catalogue, RFM segments, cohorts, sales reps, basket pairs). Retention is healthy at 72–85% of each cohort per year, 43% of the catalogue has never sold, and 14 at-risk high-value customers hold 25% of all revenue.

So what: Growth has to come from acquisition, not retention spend, while the at-risk high-value customers get a targeted win-back.

  • SQL
  • SQLite
  • CTEs & window functions
  • Python
  • pandas

Data: Chinook sample database (synthetic) · Finished 2026-09-23 · Last commit 2026-09-23

Heatmap of cohort retention for the only two customer cohorts, 2009 and 2010: between 72% and 100% of each cohort still buys in each following year.